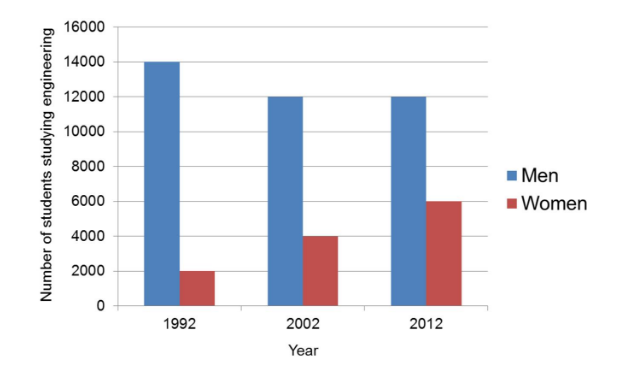
The bar chart illustrates the number of men and women studying engineering at Australian universities between the years 1992 and 2012. It can be seen that the number of male students fell slightly from 14,000 in 1992 to 12,000 in 2002. The number of female students is relatively low, starting at 2,000 in 1992. However, while the number of men decreased, the number of women increased. Female students grew steadily by 2,000 each decade. Overall, we can see a clear upward trend in the number of female engineering students in Australian universities, while the number of male students seem to have leveled off.
2. Sample Image 2
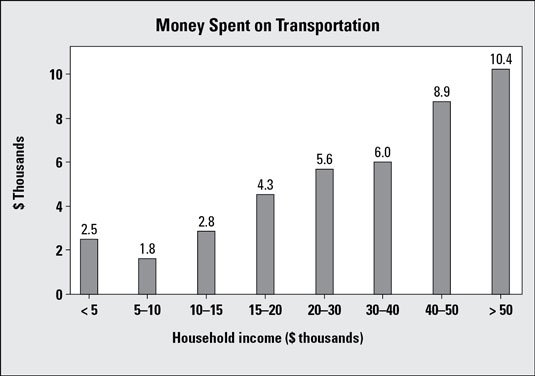
Model Answer
This particular bar graph shows how much money is spent on transportation for people in different household-income groups. It appears that as household income increases, the total expenditures on transportation also increase. The households in the first group make less than $5,000 a year and have to spend $2,500 of it on transportation. This makes sense, because the more money people have, the more they have available to spend.
3. Sample Image 3
Model Answer
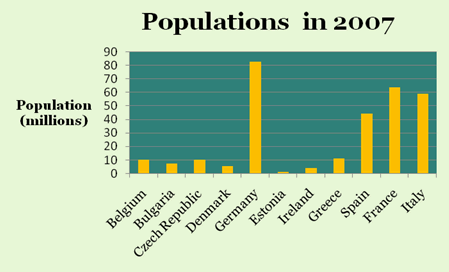
This chart shows the populations of some European countries in 2007. The country with the largest population is Germany, with over 80 million people whereas Estonia has the smallest population, at little more than a million. Belgium, Bulgaria, the Czech Republic, Denmark, Estonia and Ireland all have populations or ten million or less, while Greece has a population of about eleven million. Apart from Germany, the largest countries are Spain, France and Italy with populations ranging from about forty-four to sixty-three million. Together, the four largest countries account for over eighty per cent of the population of the countries shown.
PLEASE SHARE YOUR ANSWERS IN COMMENT SECTION FOR REMAINING IMAGES