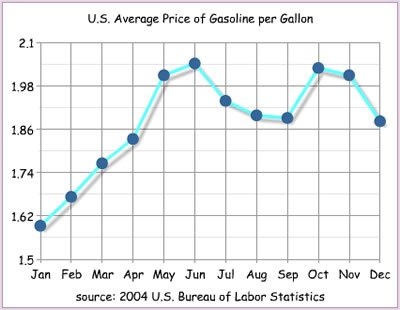
Model AnswerThis image shows a data table comparing several categories across multiple groups or time periods. To describe a table effectively in PTE, begin by introducing the subject — what the table shows and what it compares. Then identify the most significant figures: the highest and lowest values, notable trends, and any comparisons between categories or groups. Use precise language, referring to specific numbers or percentages where relevant. Conclude by summarising the overall pattern revealed by the data. Practice describing this table aloud using this structure: Introduce → Highlight key data → Compare → Conclude.
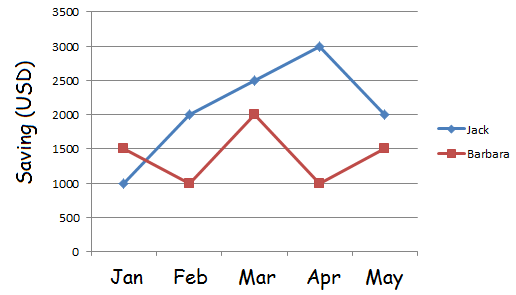
2. Sample Image 2 (Process Diagram)

Model AnswerThis image shows a process diagram illustrating a series of stages or steps. When describing a process diagram in PTE, begin by introducing what process is being shown. Then describe each stage in sequence, using discourse markers such as “first,” “then,” “following this,” “after which,” and “finally.” Note any inputs and outputs at each stage, any materials or energy involved, and whether the process is linear or cyclical. Conclude by summarising what the process produces or achieves. Practice describing this process aloud, following each step in the correct order and using accurate sequencing language.
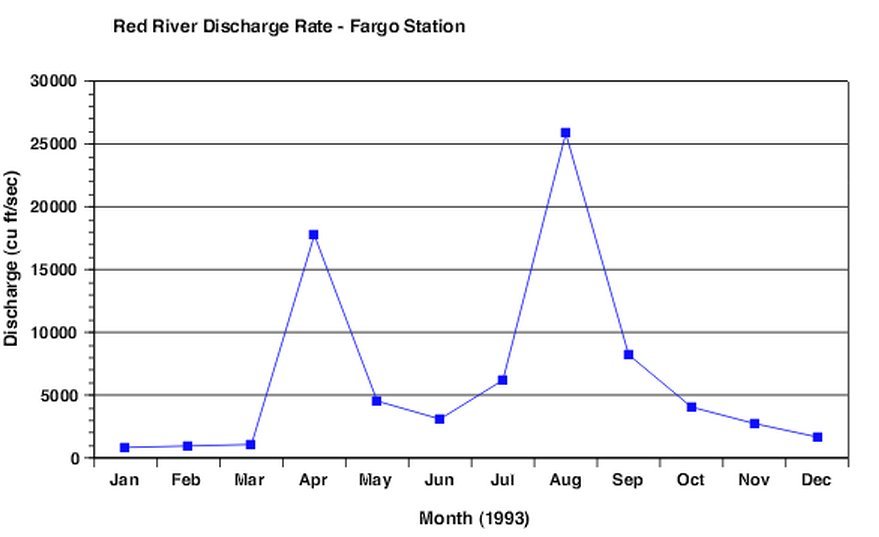
3. Sample Image 3 (Map)

Model AnswerThis image shows a map illustrating geographical information. When describing a map in PTE, begin by introducing what the map represents and what region it covers. Then identify and describe the key features shown — such as locations, boundaries, changes between time periods, or distributions of phenomena across a geographical area. Use directional language — north, south, east, west — and spatial descriptors such as “concentrated in the centre,” “spread across the western region,” or “absent from the southern areas.” Conclude by summarising the main geographical pattern or change shown. Practice describing this map aloud, covering the introduction, key features, comparisons, and conclusion.